00 / The route question
The fastest routeisn't always the calmest.
MoodMaps adds a 0–100 calmness estimate beside the routes already visible in your map—so time, traffic and driving friction can be compared in one place.
01 / In place
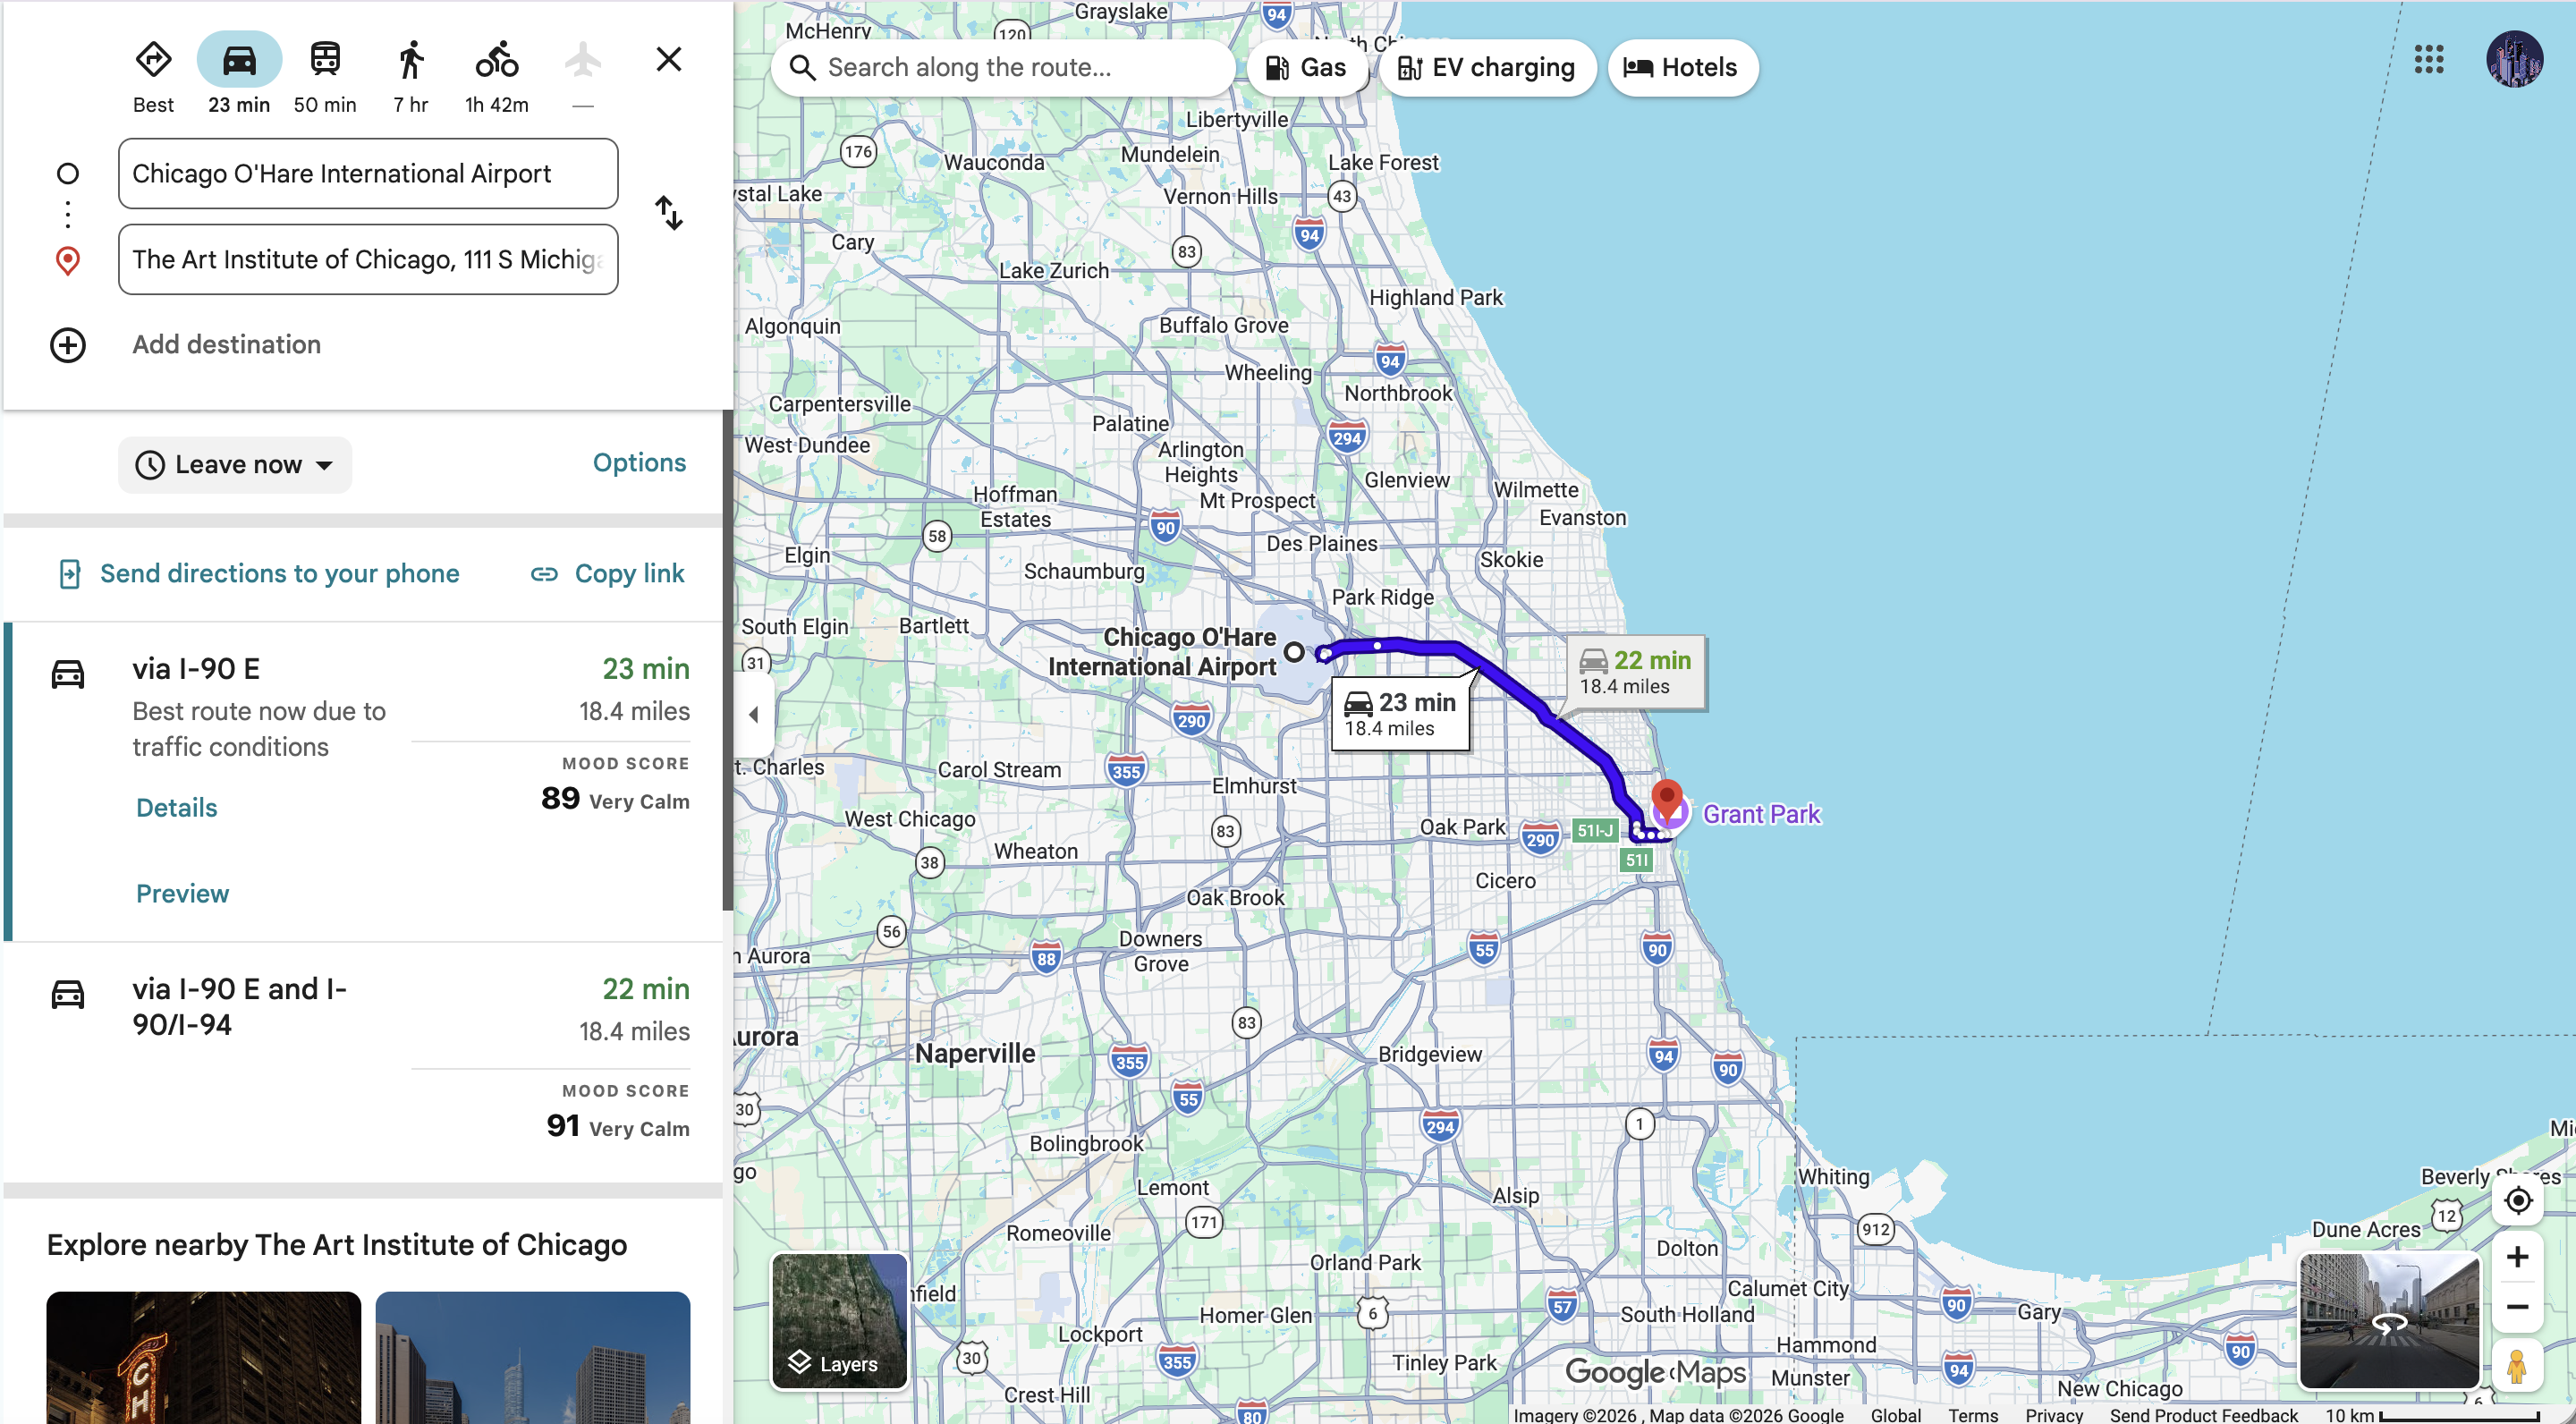
One layer. The map you already use.
MoodMaps reads the route choices already present on the page, normalizes their visible details, and returns a score without asking you to plan the same trip twice.
02 / Signal
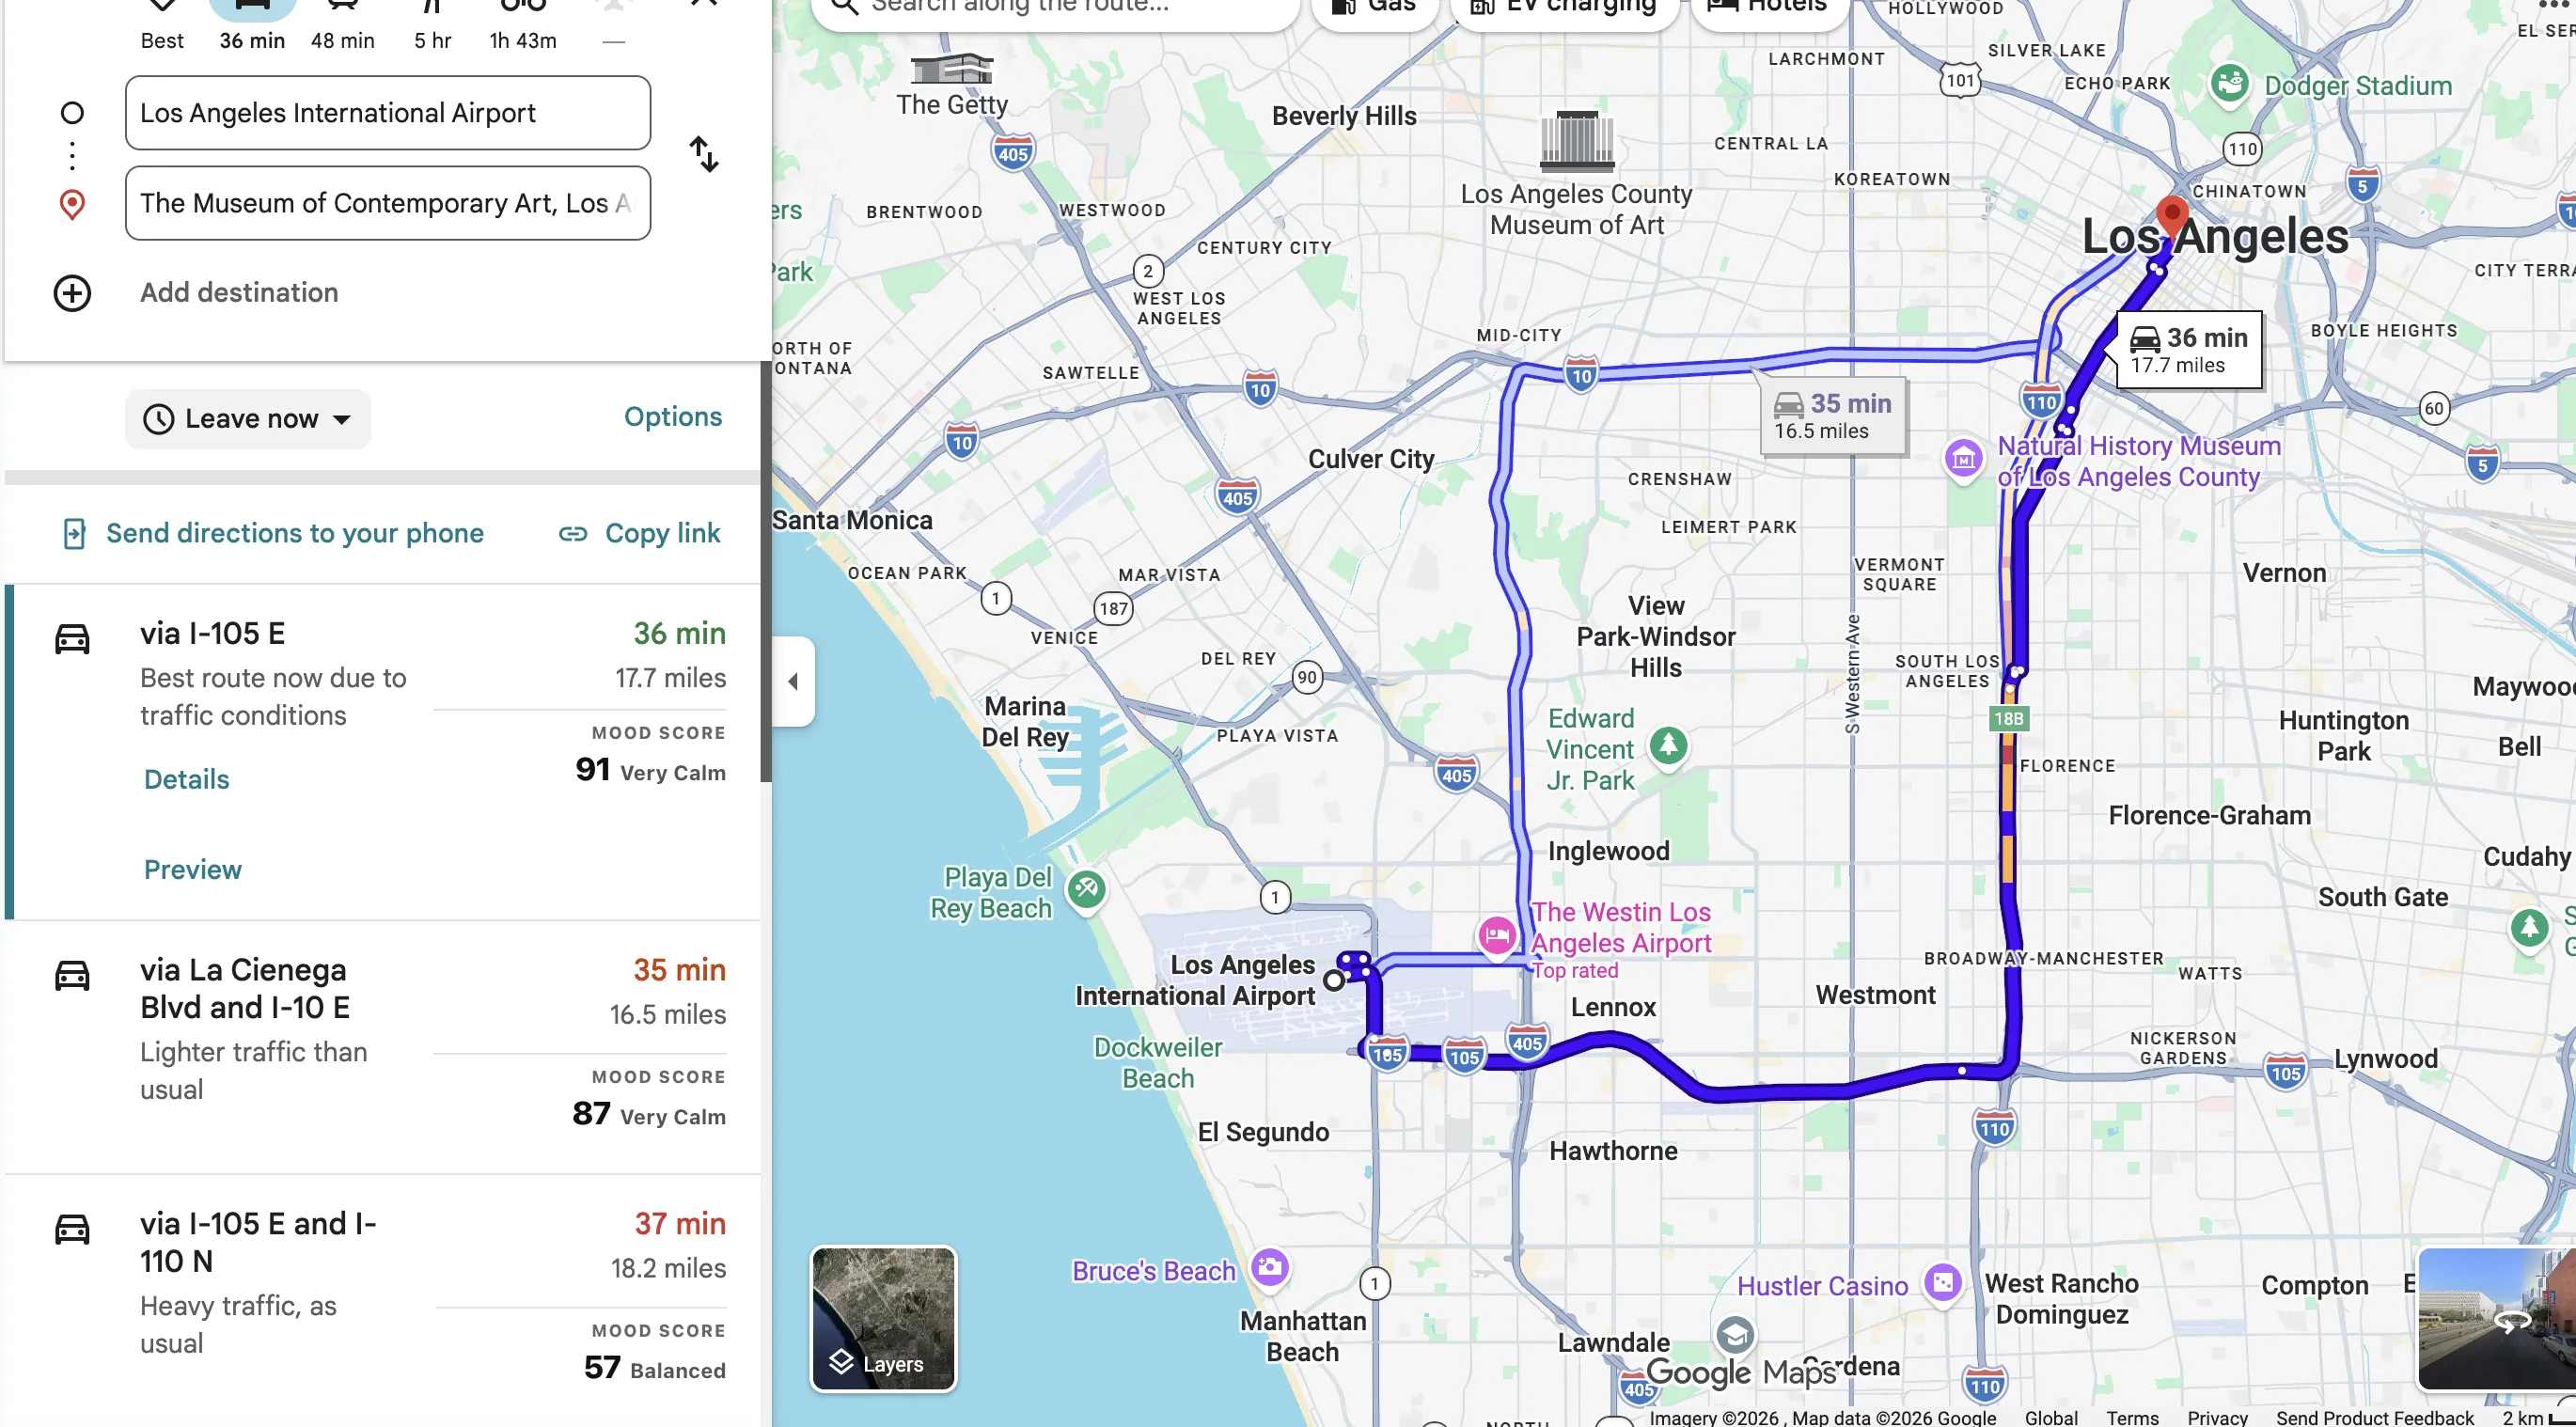
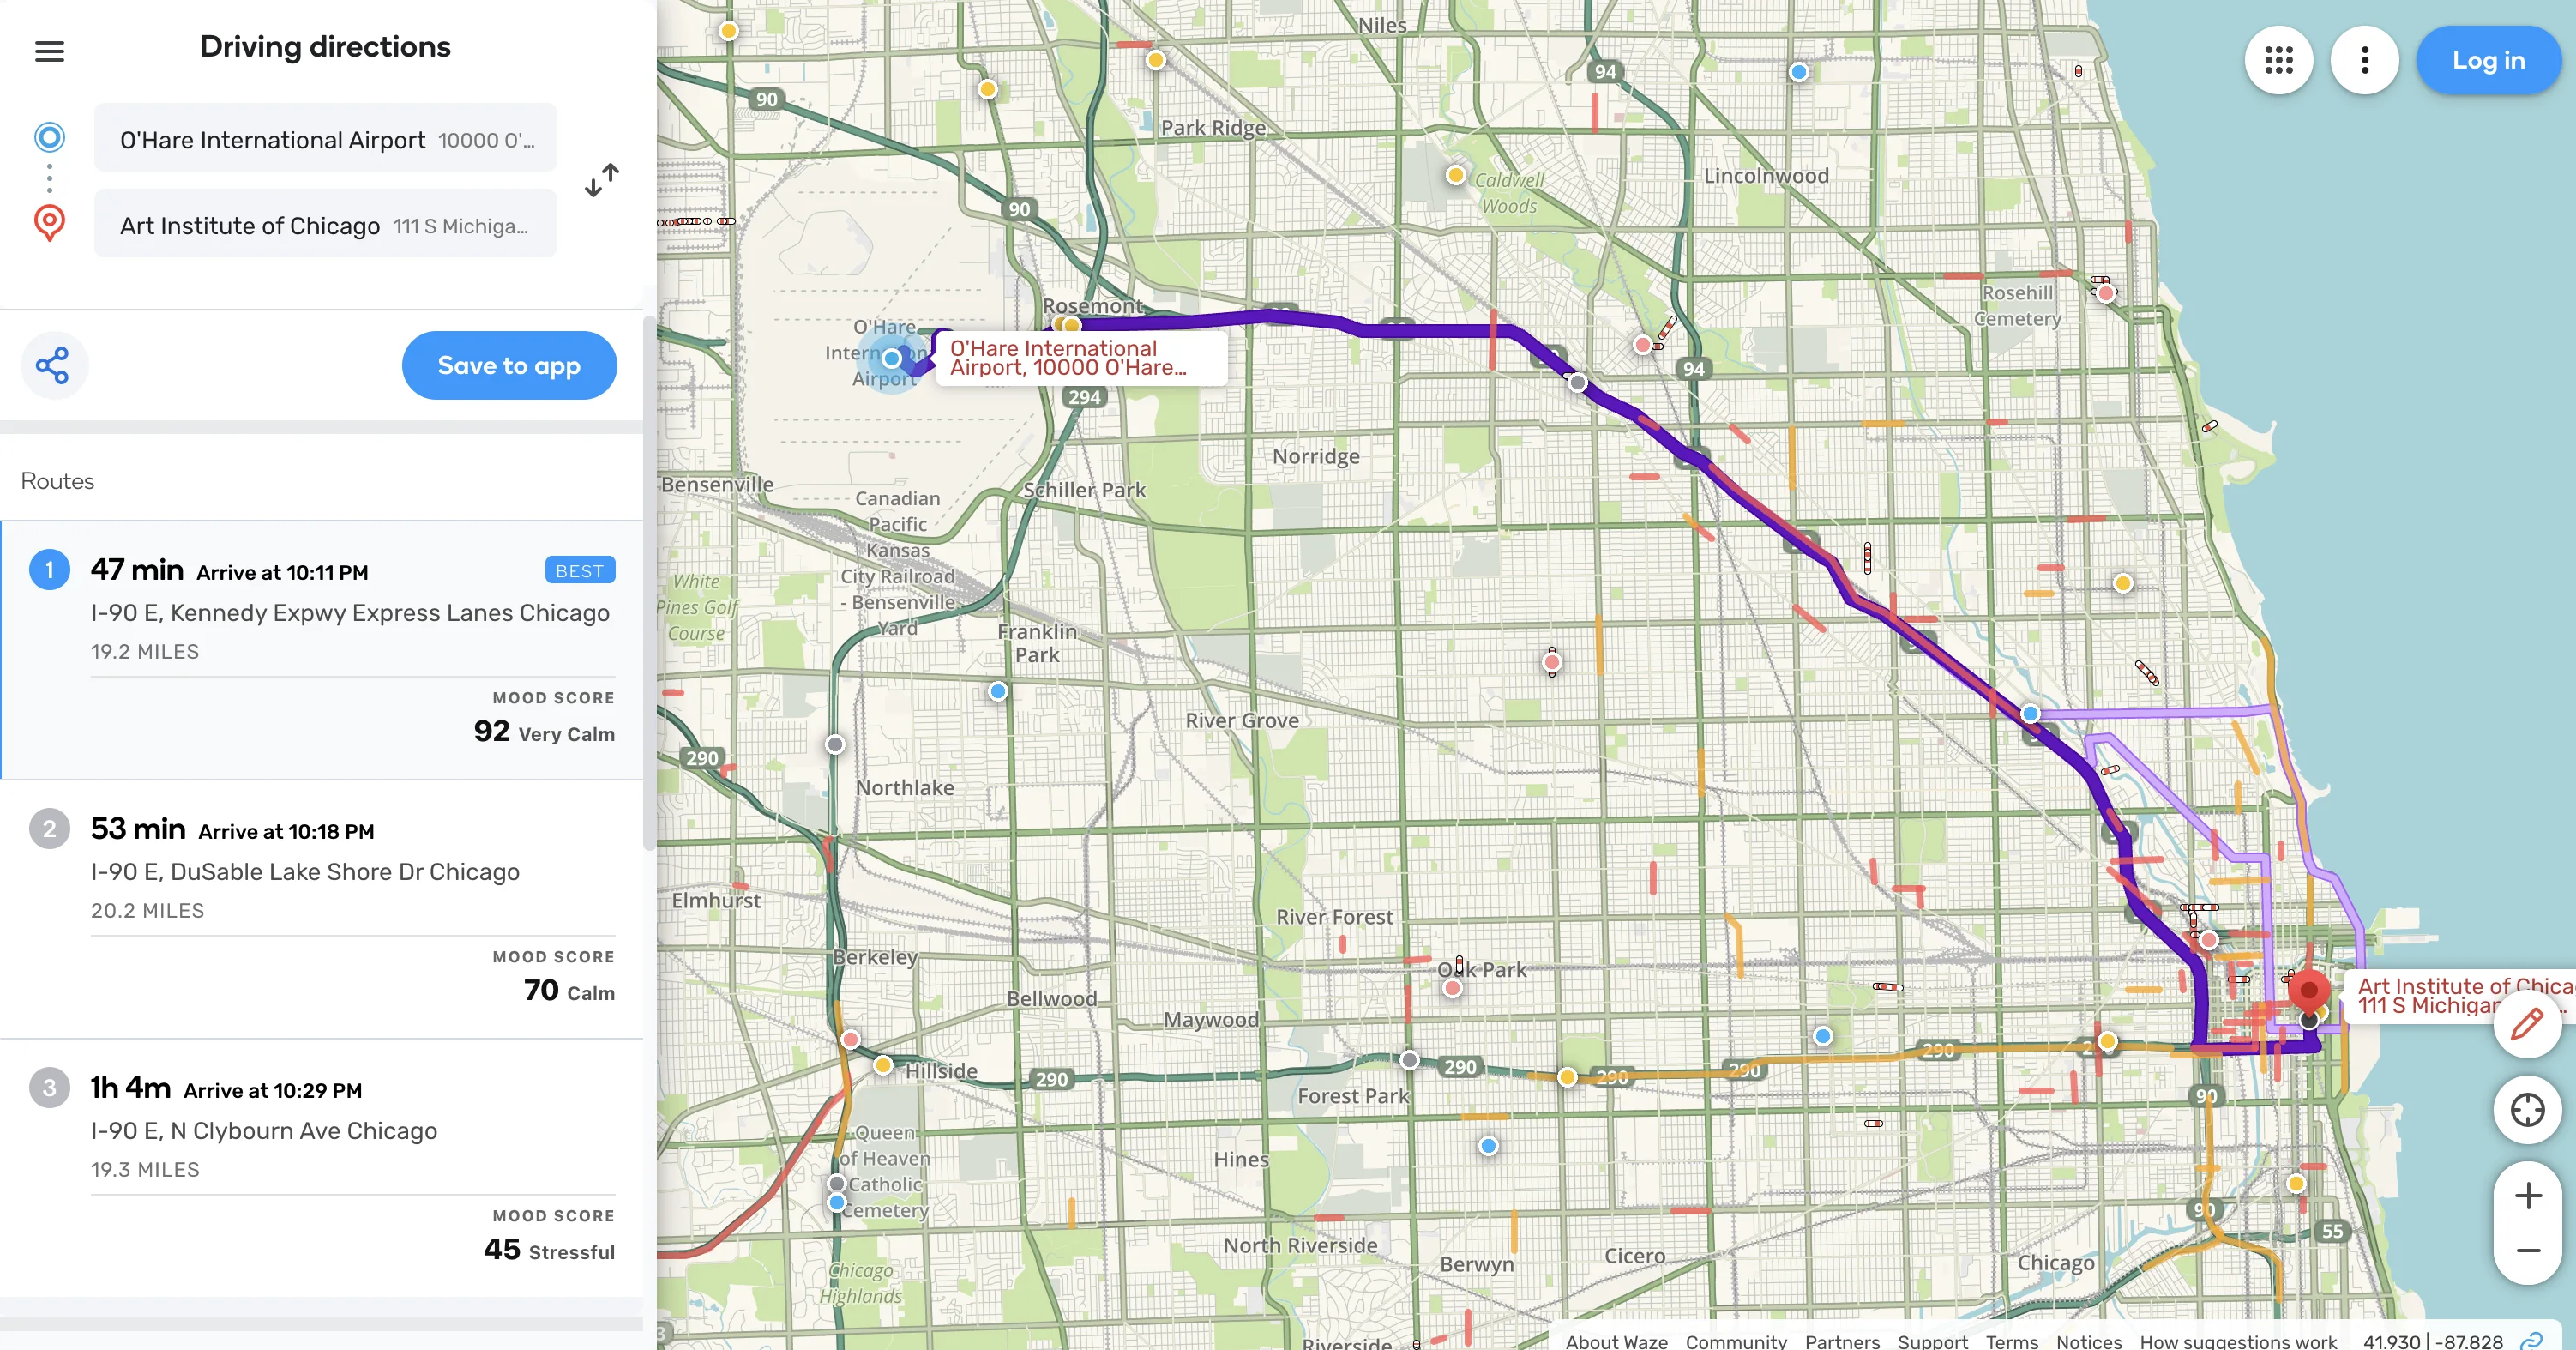
Five signals. One explainable score.
A score is useful only when its reasoning is visible. Open any Mood Score to see the factors, weights and route-specific contribution behind it.
Example / Selected route
92Visible congestion and relative pace across the available routes.
How much slower a route appears compared with nearby alternatives.
A repeatable route-name proxy for route friction—not a turn count.
Optional current conditions when a coarse location is available.
Trip length considered alongside the other sources of stress.
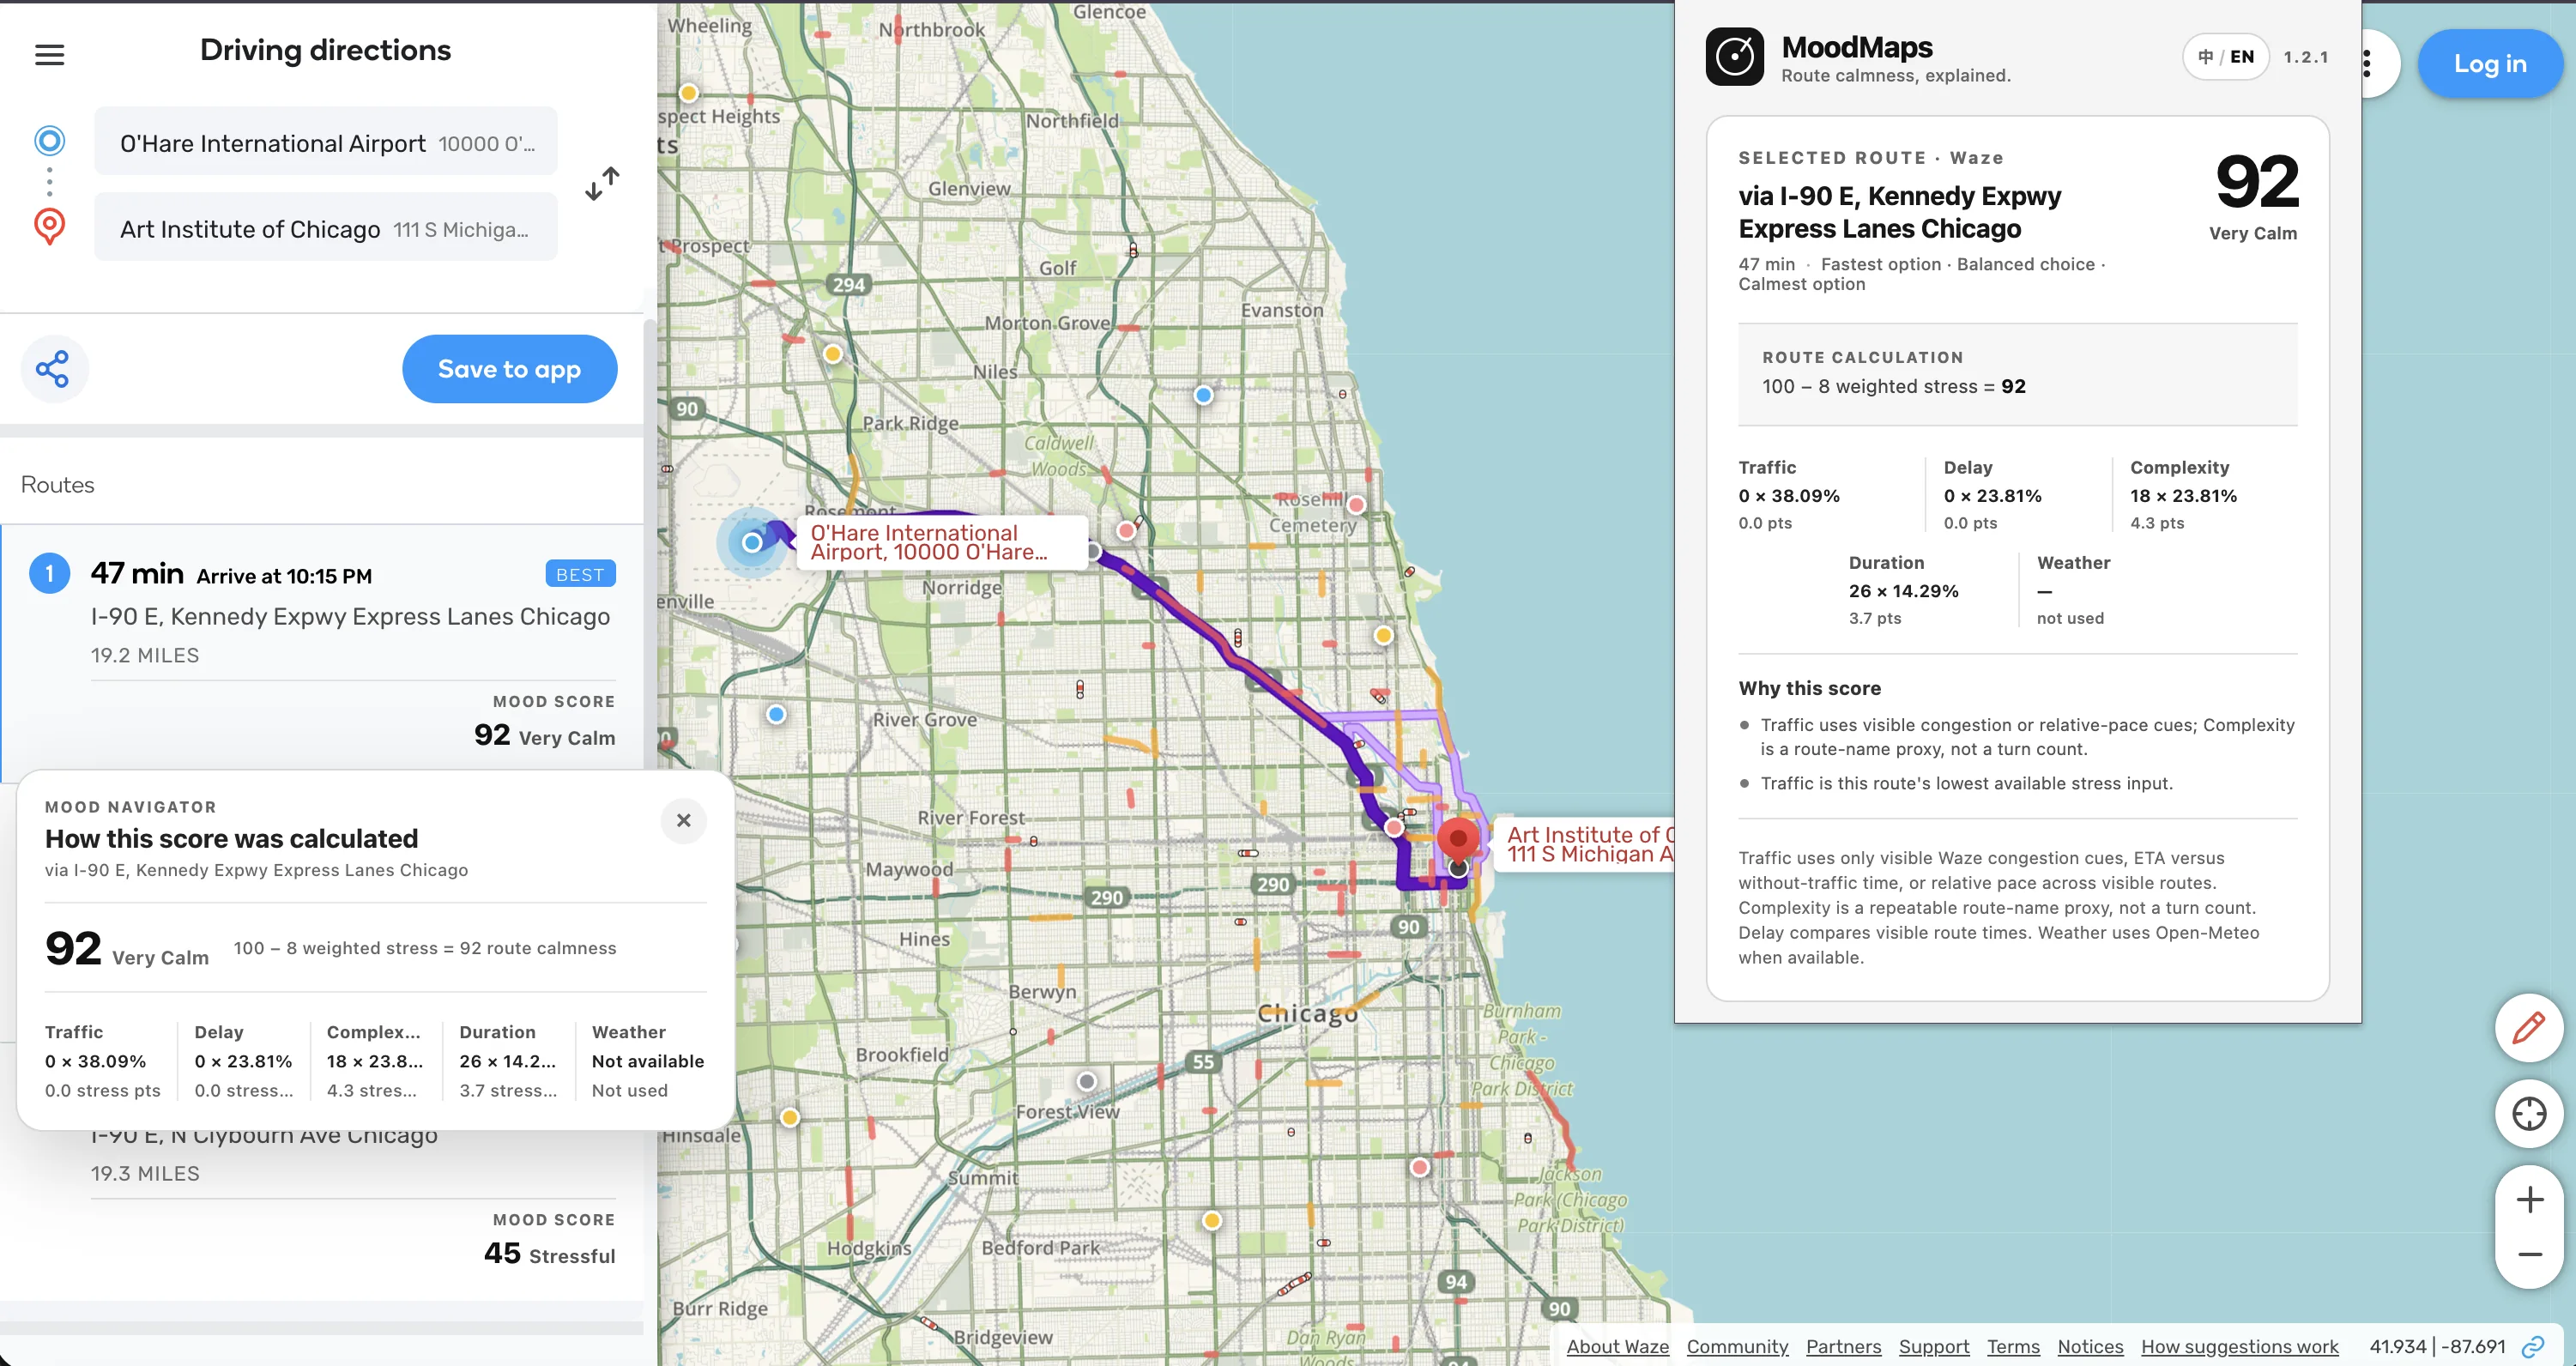
Missing data does not become fake certainty.If one signal is unavailable, MoodMaps excludes it and rebalances the remaining weights instead of silently treating the missing value as zero.
What drivers selected first.
Participants could select up to three route-condition concerns. Traffic and weather emerged most often, while passenger attitude and remote destinations added important context beyond speed alone.
Share of all 209 respondents selecting each factor among up to three concerns.
View methodology and all survey data
| Type | Count | Share |
|---|---|---|
| Food delivery riders | 84 | 40.2% |
| Ride-hailing drivers | 59 | 28.2% |
| Taxi drivers | 21 | 10.0% |
| Other driving / delivery workers | 45 | 21.5% |
| Weekly hours | Count | Share |
|---|---|---|
| Less than 10 hours | 42 | 20.1% |
| 10–30 hours | 67 | 32.1% |
| 31–50 hours | 68 | 32.5% |
| More than 50 hours | 32 | 15.3% |
| Factor | Average / 5 | Strong influence | Top-three concern |
|---|---|---|---|
| Bad weather | 4.26 | 84.2% | 60.3% |
| Low passenger / customer rating or attitude | 3.97 | 72.2% | 37.8% |
| Traffic congestion | 3.96 | 72.7% | 73.2% |
| Remote destination | 3.85 | 69.9% | 37.3% |
| Too many traffic lights | 3.76 | 67.9% | 34.0% |
| Too many turns / complex route | 3.76 | 68.4% | 13.9% |
| Long distance | 3.51 | 56.9% | 8.6% |
| Weekend / holiday | 3.12 | 41.1% | 21.1% |
04 / System
A local extension pipeline.
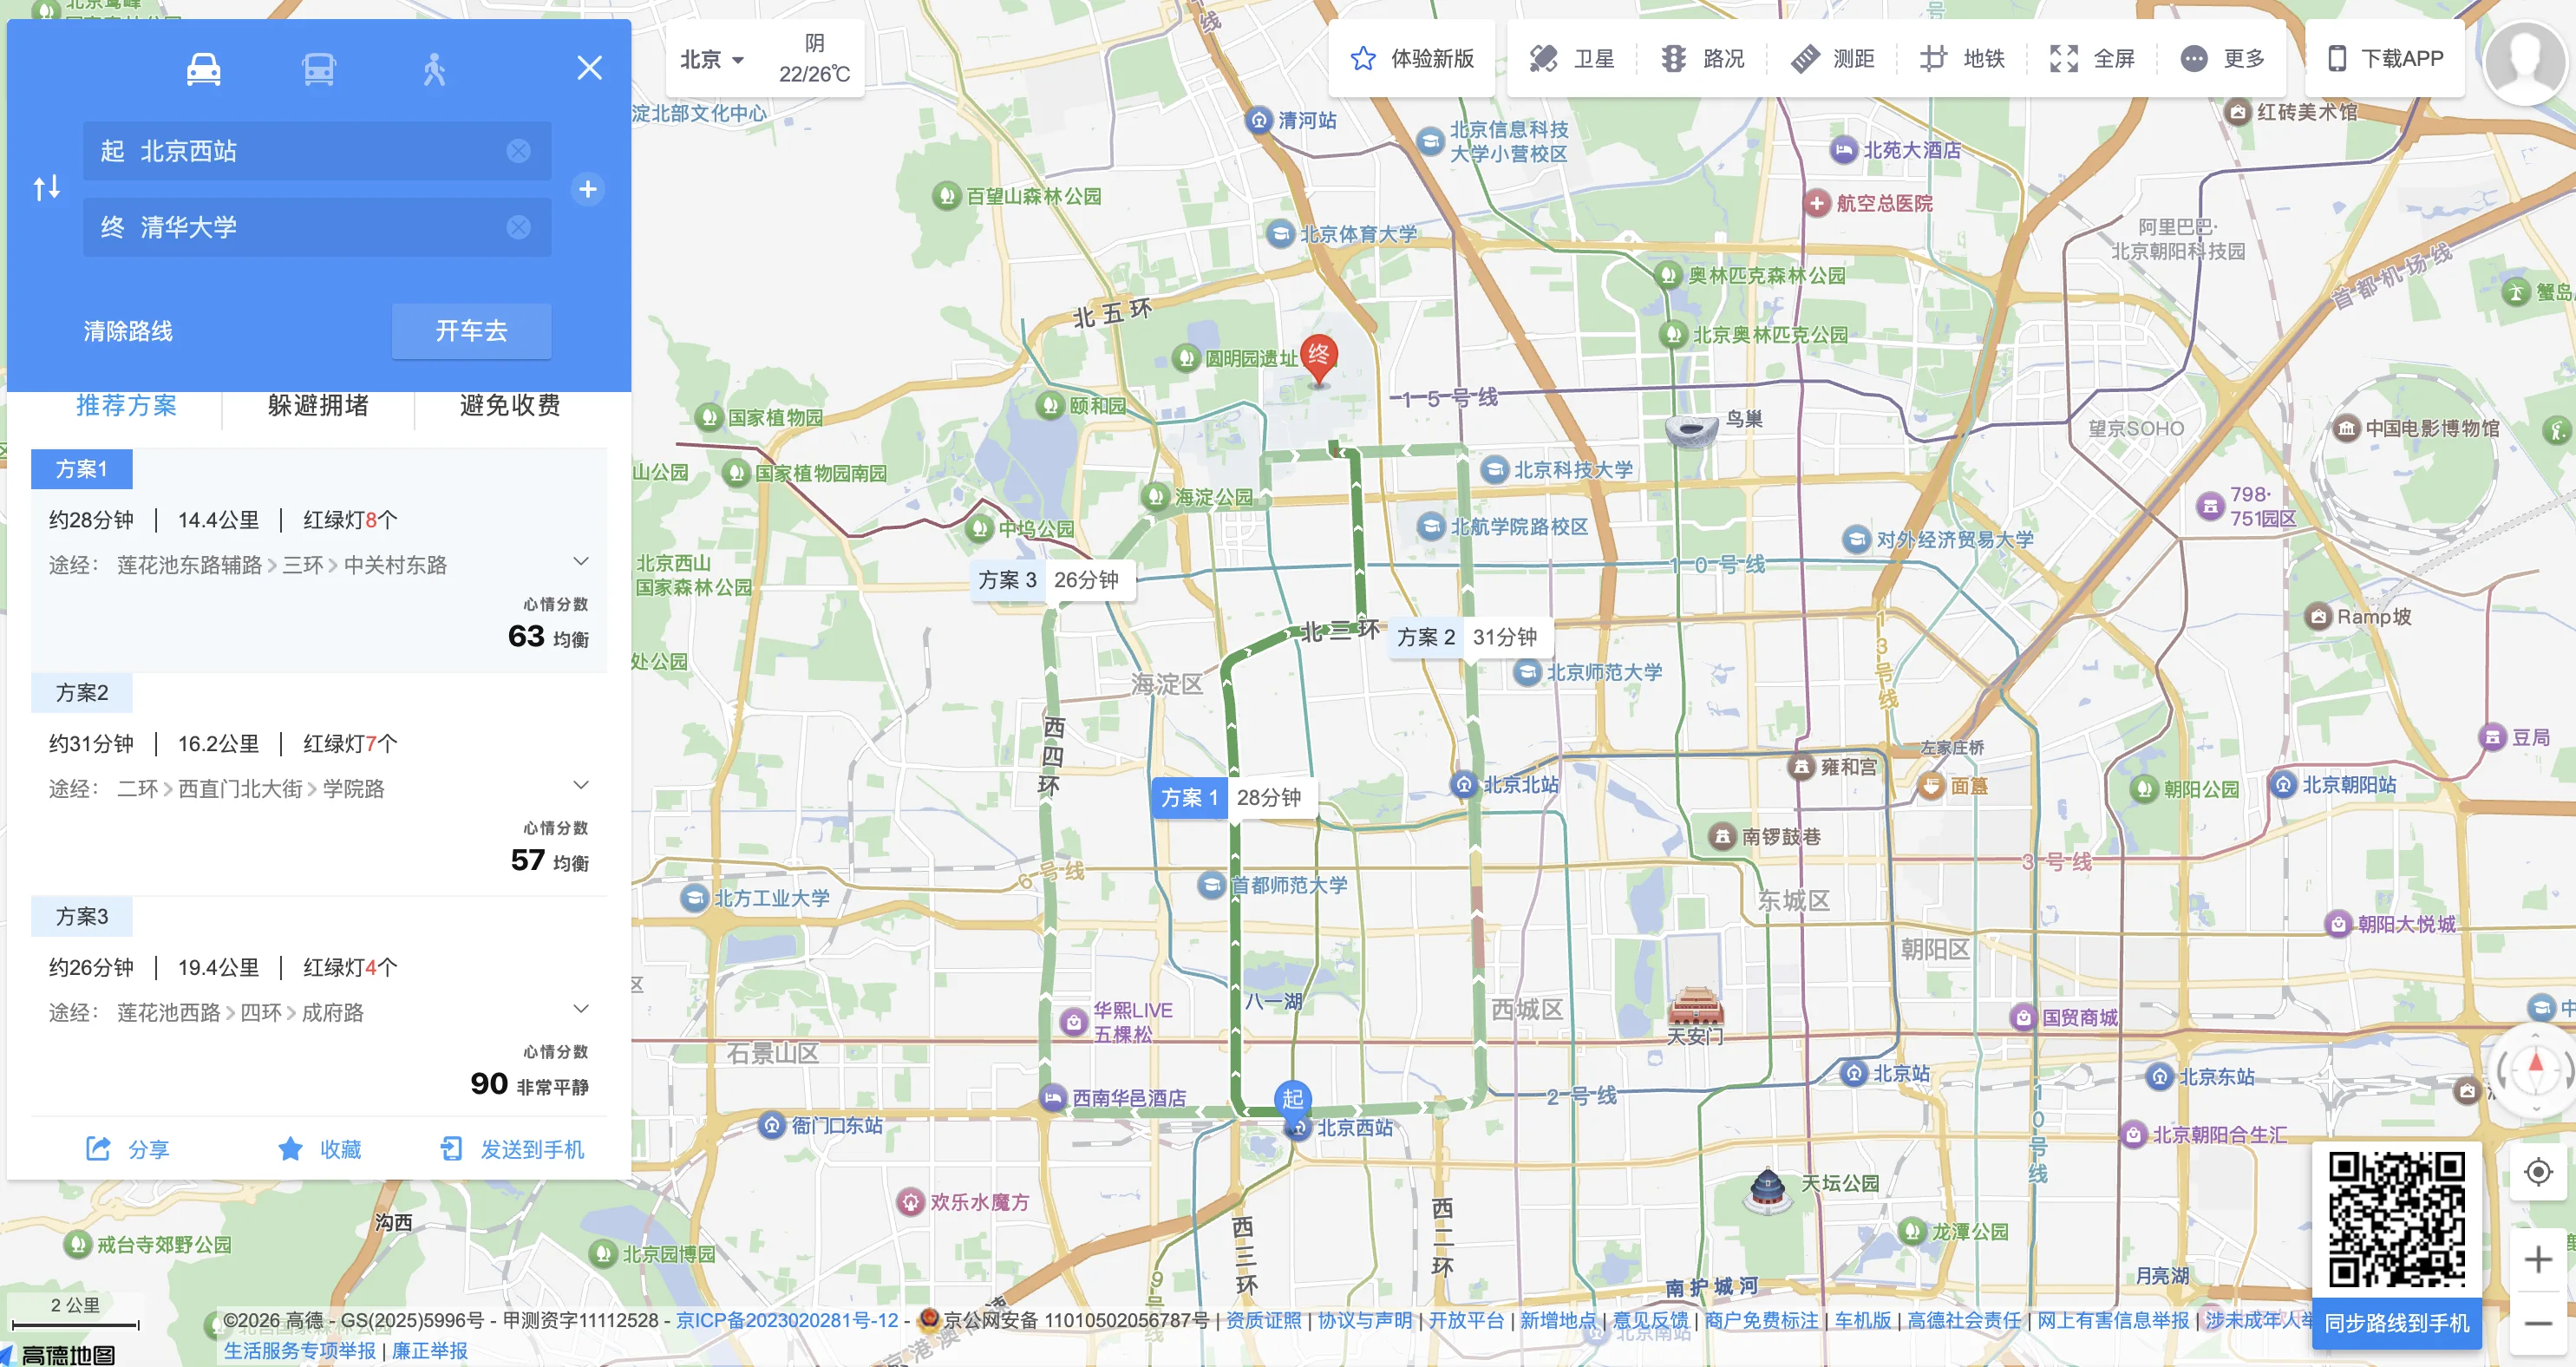
Provider adapters turn visible route cards into one local schema. A Manifest V3 service worker calculates the result, then returns it to the map and extension panel.
- HTML47.1%
- TypeScript24.3%
- Python13.4%
- Jupyter Notebook10.1%
- CSS4.3%
- JavaScript0.7%
- Shell0.1%
- Dockerfile<0.1%
- Route cards appear
Google Maps, Apple Maps, Waze or Amap displays driving options.
- Read the visible page
A content script watches the current route cards and live updates.
- Normalize each route
Provider adapters convert visible details into one consistent local schema.
- Calculate locally
The service worker weighs traffic, delay, complexity, duration and optional weather.
- Return the result
Scores and factor details appear inside the original route cards and extension panel.
Private by default.
- Route scoring stays in the browser.The full map URL, page DOM, browsing history and precise address text are not uploaded.
- Weather stays coarse and optional.Open-Meteo receives an endpoint midpoint or coarse city / region text—not raw address or POI names.
- Context is temporary.Route context is cleared when the page navigates or the tab closes.
Mood Score is an experimental comfort estimate—not a safety, medical or navigation guarantee.